Materials & Methods
Theory
Electrophoresis
Electrophoresis refers to the movement of charged particles under a uniform electric field, which is dependent on the charge and size of a sample. It is a popular technique used often for DNA and RNA molecules. During electrophoresis, the particle is driven towards either cathode (+) or anode (-) due to the charged interface between particle surface and surrounding fluid.
As for gel electrophoresis, electric field facilitates the movement of the particle through the gel. Because how fast a molecule move is proportional to its size, smaller molecules move faster and travel further than larger ones. In addition, the mobility of the sample could be inferred based on the distance it travelled.
Though Gel electrophoresis can be performed using either agarose or polyacrylamide, the latter has a greater resolving power.
Atomic Force Microscopy
Atomic Force Microscopy (AFM) is a technique applied for imaging with a very high resolution. Its working principle is based on the force measurement using a cantilever with a sharp probe while scanning the sample surface. As the tip of probe moves up and down with respect to surface, gathered information could be utilized to acquire 3D image of the sample surface (topography). The imaging result is usually displayed as a pseudocolor plot.
In contrast to Scanning Tunneling Microscopy (STM) that could only image conducting or semi-conducting surfaces, AFM overcomes this drawback as almost any type of surface imaging could be achieved. Two other advantages of AFM are no vacuum or pre-treatment required for imaging.
Transmission Electron Microscopy
Transmission electron microscopy (TEM, also sometimes conventional transmission electron microscopy or CTEM) is a microscopy technique in which a beam of electrons is transmitted through a specimen to form an image. The specimen is most often an ultrathin section less than 100 nm thick or a suspension on a grid. An image is formed from the interaction of the electrons with the sample as the beam is transmitted through the specimen. The image is then magnified and focused onto an imaging device, such as a fluorescent screen, a layer of photographic film, or a sensor such as a charge-coupled device.
Transmission electron microscopes are capable of imaging at a significantly higher resolution than light microscopes, owing to the smaller de Broglie wavelength of electrons. This enables the instrument to capture fine detail-even as small as a single column of atoms, which is thousands of times smaller than a resolvable object seen in a light microscope. Transmission electron microscopy is a major analytical method in the physical, chemical and biological sciences. TEMs find application in cancer research, virology, and materials science as well as pollution, nanotechnology and semiconductor research.
Experiment Protocol
Gel Electrophoresis
Mg2+ concentration for DNA Origami (Supplementary Experiment 1.1.)
First, we prepared the samples ①-⑤ for annealing by the following procedures.
10 nM DNA Origami samples were prepared by mixing 180 staple-strands with M13 (7249 nt).
50 µL of 50 mM Tris-HCl (pH 8.0), 20 µL of 10 mM EDTA (pH 8.0), were also prepared for each solution.
For Experiment 1, to examine the optimal Mg2+ concentration, MgCl2 buffer for samples ①-⑤ were adjusted to ①10 mM, ②12.5 mM , ③ 15 mM, ④ 17.5 mM, ⑤ 20 mM as a gradient.
The final concentration of samples ①-⑤ for annealing are shown in Table 1 below.
| Sample | ① | ② | ③ | ④ | ⑤ |
|---|---|---|---|---|---|
| M13 | 10 nM | 10 nM | 10 nM | 10 nM | 10 nM |
| staples | 50 nM | 50 nM | 50 nM | 50 nM | 50 nM |
| Mg2+ | 10 mM | 12.5 mM | 15 mM | 17.5 mM | 20 mM |
DNA samples were annealed according to the protocol below. Annealed samples were obtained after about 16 hours.
\begin{align}
&85℃ \xrightarrow{5 \ min} 65℃ \xrightarrow{15 \ min} 60℃ \xrightarrow{-1℃/1hr.} 44℃ \xrightarrow{automatic} 25℃
\end{align}
Then, electrophoresis was performed to check the annealed samples.
The samples for electrophoresis were prepared as Table 2 shows below.
| annealed Sample | annealed ① | annealed ② | annealed ③ | annealed ④ | annealed ⑤ |
|---|---|---|---|---|---|
| M13 | 1 nM | 1 nM | 1 nM | 1 nM | 1 nM |
| Staples | 5 nM | 5 nM | 5 nM | 5 nM | 5 nM |
| Mg2+buffer | 10 mM | 12.5 mM | 15 mM | 17.5 mM | 20 mM |
| loading buffer | 1x | 1x | 1x | 1x | 1x |
Electrophoresis was performed as follows.
1% Agarose gel electrophoresis
We prepared 1% agarose gel and performed gel electrophoresis following the standard procedures below.
- 10 mL 5×TBE buffer, 1.0 g agarose powder (Takara Japan), 4 mL 125 mM MgCl2 buffer, 86 mL mQ were mixed to make 100 mL/1% gel.
- Mixture was heated by microwave for 30 sec. and solidified for approximately 50 mins, at 25℃.
- Solidified gel was set on electrophoresis chamber (Mupid-2plus, Mupid, JAPAN).
- 50 mL 5×TBE buffer, 2.5 mL 1 M MgCl2 buffer, 447.5 mL mQ were mixed to make 500 mL running buffer and poured into the electrophoresis chamber.
- Annealed sample ①-⑤ were prepared by mixing with corresponding MgCl2 buffer (10 mM, 12.5 mM, 15 mM, 17.5 mM, 20 mM), loading buffer and mQ. Simultaneously, 1×loading ladder solution (20k bps) and 1 nM M13 solution were prepared by mixing loading buffer and mQ.
- 7 µL of each mixture was applied into each well.
- 50 V of voltage was applied for 100 mins in 4℃.
- Gel was stained by SYBR GOLD for 30 mins.
- Fluorescence was observed by gel imager (ChemiDoc MP, BIO-RAD, USA).
0.8% Agarose Gel Electrophoresis for Lock Structure (Supplementary Experiment 2.)
We prepared samples ①-⑮ for annealing by the following procedures.
DNA Origami samples ①-⑮ were prepared by annealing different amounts of Lock DNA strands with 50 nM 180 staple-strands and 10 nM M13 (7249 nt).
50 µL of 50 mM Tris-HCl (pH 8.0) and 20 µL of 10 mM EDTA (pH 8.0) were also prepared for each solution.
To examine the optimal amount of lock DNA strands to close the Open-state unit, the strand-amount gradient was set up as seen in the following Table 3. (See Design for Lock Position)
| Sample Name | Number of Locks | Lock Position | Note |
|---|---|---|---|
| 1 | N=1 | L10 | |
| 2 | N=2 | L10, L15 | |
| 3A | N=3 | L2, L10, L13 | one each on left, middle and right sides |
| 3B | N=4 | L8, L9, L11 | three in the middle |
| 4 | N=4 | L8, L9, L10, L11 | |
| 5 | N=5 | L1, L2, L3, L4, L5 | five on left side |
| 5R | N=5 | L12, L13, L14, L15, L16 | five on right side |
| 6 | N=6 | L2, L4, L8, L10, L13, L15 | |
| 9 | N=9 | L2, L3, L4, L8, L9, L10, L13, L14, L15 | |
| 12 | N=12 | L2, L3, L4, L5, L8, L9, L10, L13, L14, L15, L16 | |
| 14 | N=14 | L1, L2, L3 L4 L5 L8, L9, L10, L11, L12, L13, L14, L15, L16 | |
| 16 | N=16 | L1, L2, L3, L4, L5, L6, L7, L8, L9, L10, L11, L12, L13, L14, L15, L16 | |
| Unit | N=0 | Open state unit without Lock DNA strand |
Annealing samples were prepared according to Table 4 below.
| Reagent | Final Concentration |
|---|---|
| M13 | 10 nM |
| Staple | 50 nM |
| Lock Staple | 50 nM |
| Buffer | 1x |
DNA samples were were annealed according to the protocol below.
Annealed samples were obtained after about 16 hours.
\begin{align}
&85℃ \xrightarrow{5 \ min} 65℃ \xrightarrow{15 \ min} 60℃ \xrightarrow{-1℃/1hr.} 44℃ \xrightarrow{automatic} 25℃
\end{align}
Then, electrophoresis was performed to check the annealed samples.
Gel electrophoresis was performed as follows.
0.8% Agarose gel electrophoresis
We prepared 0.8% agarose gel and performed gel electrophoresis following the standard procedures below.
- 10 mL 5×TBE buffer, 0.8 g agarose powder (Takara Japan), 4 mL 125mM MgCl2 buffer, 86 mL mQ were mixed to make 100 mL/0.8% gel.
- Mixture was heated by microwave for 30 sec. and solidified for approximately 50 mins, at 25℃.
- Solidified gel was set on electrophoresis chamber (Mupid-2plus, Mupid, JAPAN).
- 50 mL 5×TBE buffer, 2.5 mL 1 M MgCl2 buffer, 447.5 mL mQ were mixed to make 500 mL running buffer and poured into the electrophoresis chamber.
- Annealed samples (1) - (13) were prepared by mixing with MgCl2 buffer, loading buffer and mQ. Simultaneously, 1×loading ladder solution (20k bps) and 1 nM M13 solution were prepared by mixing loading buffer and mQ.
- 7 µL of each mixture was applied into each well.
- 100 V of voltage was applied for 50 mins in 4℃.
- Gel was stained by SYBR GOLD for 30 mins.
- Fluorescence was observed by gel imager (ChemiDoc MP, BIO-RAD, USA).
Polyacrylamide Gel Electrophoresis for DNA Strand Mechanism (Supplementary Experiment 3., Main Experiment 3.)
For the experiments to confirm the DNA Strand mechanism, Polyacrylamide gel electrophoresis was performed according to the protocol below.
Polyacrylamide gel electrophoresis
We prepared 10% polyacrylamide gel and performed gel electrophoresis following the standard procedures below.
- 1.8 mL 5×TBE buffer, 3 mL 30%-Acrylamide/Bis Mixed Solution , 90 µL 10% Ammonium Persulfate (APS), 9 µL TEMED were mixed to make 9 mL/10% polyacrylamide gel.
- Mixture was solidified for approx. 30 mins, at 25 ℃.
- Solidified gel was set on electrophoresis chamber.
- 1×TBE buffer running buffer was poured into electrophoresis chamber.
- 1×ladder solution (20 bps), strand samples were prepared.
- 7 µL of each mixture was applied into each well.
- 100 V voltage was applied for 45 mins in 4 ℃.
- Gel was stained by SYBR GOLD for 30 mins.
- Fluorescence was observed by gel imager (ChemiDoc MP, BIO-RAD, USA).
Close concentration Condition (Supplementary Experiment 3.1.)
Latch X + Latch Y: Close
| Concentration ratio | |||||||
|---|---|---|---|---|---|---|---|
| sample | ① 1:1 | ② 1:1.2 | ③ 1:1.4 | ④ 1:1.6 | ⑤ 1:1.8 | ⑥ 1:2.0 | ⑦ 1:2.5 |
| latch XY / μM | 1 | 1 | 1 | 1 | 1 | 1 | 1 |
| close DNA / μM | 1 | 1.2 | 1.4 | 1.6 | 1.8 | 2.0 | 2.5 |
| MgCl2 / mM | 12.5 | 12.5 | 12.5 | 12.5 | 12.5 | 12.5 | 12.5 |
Samples ①-⑦ were incubated for 30 mins, in 25 ℃.
After incubation, Samples ①-⑦ were mixed with 1×loading buffer, 12.5 mM MgCl2 buffer, and mQ for the electrophoresis. Polyacrylamide gel electrophoresis was performed later (100 V, 80 mins, 4 ℃).
Anti-Close Concentration Condition (Supplementary Experiment 3.2.)
Latch X,Y:Close:Anti-Close
- 8 μL 4 μM Latch X DNA strand solution, 8 μL 4 μM Latch Y DNA strand solution and mQ were mixed to make 20 μL 4 μM Latch X,Y DNA strands mixture.
- 10 μL 4 μM Latch X,Y DNA strands mixture, 4.8 μL 10 μM Close DNA strand solution, 4 μL 12.5 mM MgCl2 buffer and 21.2 μL mQ were mixed to make Latch X,Y + Close mixture (Latch X,Y:Close = 1:1.2). The Latch X,Y+Close mixture was incubated for 30 mins, in 25 ℃.
- After incubation, Latch X,Y+Close mixture and Anti-Close DNA strand solution were mixed by different concentration ratios.The concentration ratios were set up as Table 6 shows below.
| Concentration ratio | ||||||||
|---|---|---|---|---|---|---|---|---|
| Sample | ① 1:1 | ② 1:1.2 | ③ 1:1.4 | ④ 1:1.6 | ⑤ 1:1.8 | ⑥ 1:2.0 | ⑦ 1:2.2 | ⑧ 1:2.4 |
| Latch X, Y / μM | 1 | 1 | 1 | 1 | 1 | 1 | 1 | 1 |
| Close / μM | 1.2 | 1.2 | 1.2 | 1.2 | 1.2 | 1.2 | 1.2 | 1.2 |
| Anti-close / μM | 1 | 1.2 | 1.4 | 1.6 | 1.8 | 2.0 | 2.2 | 2.4 |
| MgCl2 / mM | 12.5 | 12.5 | 12.5 | 12.5 | 12.5 | 12.5 | 12.5 | 12.5 |
Samples ①-⑧ were incubated for 30 mins, in 25 ℃.
After incubation, Samples ①-⑧ were mixed with 1×loading buffer, 12.5 mM MgCl2 buffer, and mQ for the electrophoresis. Polyacrylamide gel electrophoresis was performed later (100 V, 80 mins, 4 ℃).
Open Concentration Conditions (Supplementary Experiment 3.3.)
Bridge:Open
- Bridge and Open were mixed by different concentration ratios.The concentration ratios were set up as Table 7 shows below.
| Concentration ratio | |||||||
|---|---|---|---|---|---|---|---|
| Sample | ① 1:1 | ② 1:1.2 | ③ 1:1.4 | ④ 1:1.6 | ⑤ 1:1.8 | ⑥ 1:2.0 | ⑦ 1:2.5 |
| Bridge / μM | 1 | 1 | 1 | 1 | 1 | 1 | 1 |
| Open / μM | 1 | 1.2 | 1.4 | 1.6 | 1.8 | 2.0 | 2.5 |
| MgCl2 buffer / mM | 12.5 | 12.5 | 12.5 | 12.5 | 12.5 | 12.5 | 12.5 |
Samples ①-⑦ were incubated for 30 mins, in 25 ℃.
After incubation, Samples ①-⑦ were mixed with 1×loading buffer, 12.5 mM MgCl2 buffer, and mQ for the electrophoresis. Polyacrylamide gel electrophoresis was performed later (100 V, 80 mins, 4 ℃).
Anti-Open Concentration Conditions (Supplementary Experiment 3.4)
Bridge:Open:Anti-Open
- 2μL 10 μM Bridge solution, 2.8 μL 10 μM Open solution, 2 μL 10 μM MgCl2 buffer and mQ were mixed to make 20 μL Bridge+Open mixture. The mixture was incubated for 30 mins, in 25 ℃.
- After incubation, Bridge+Open mixture and Anti-Open solution were mixed by different concentration ratios.The concentration ratios were set up as Table 8 shown below.
| Concentration ratio | ||||||||
|---|---|---|---|---|---|---|---|---|
| Sample | ① 1:1 | ② 1:1.2 | ③ 1:1.4 | ④ 1:1.6 | ⑤ 1:1.8 | ⑥ 1:2.0 | ⑦ 1:2.2 | ⑧ 1:2.4 |
| Bridge / μM | 1 | 1 | 1 | 1 | 1 | 1 | 1 | 1 |
| Open / μM | 1.4 | 1.4 | 1.4 | 1.4 | 1.4 | 1.4 | 1.4 | |
| Anti-Open / μM | 1 | 1.2 | 1.6 | 1.8 | 2.0 | 2.2 | 2.4 | |
| MgCl2 buffer / mM | 12.5 | 12.5 | 12.5 | 12.5 | 12.5 | 12.5 | 12.5 | 12.5 |
Samples ①-⑧ were incubated for 30 mins, in 25 ℃.
After incubation, Samples ①-⑧ were mixed with 1×loading buffer, 12.5 mM MgCl2 buffer, and mQ for the electrophoresis. Polyacrylamide gel electrophoresis was performed later (100 V, 80 mins, 4 ℃).
Integrated Confirmation of DNA Strand Mechanisms (Main Experiment 3.)
Sample combinations of DNA strands for integrated experiments are shown in Table 9 below.
| ① | ② | ③ | ④ | ⑤ | ⑥ | ⑦ | ⑧ | ⑨ | |
| Latch X, Y / μM | 1 | 1 | |||||||
| Close / μM | 1 | 1 | 1 | ||||||
| Anti-close / μM | 1 | 1 | |||||||
| Bridge / μM | 1 | 1 | 1 | ||||||
| Open / μM | 1 | 1 | 1 | ||||||
| Anti-Open / μM | 1 | 1 | 1 |
- 8 μL 4 μM Latch X solution, 8 μL 4 μM Latch Y solution and mQ were mixed to make 20 μL 4 μM Latch X, Y mixture.
- 4 μL 10 μM Latch X,Y solution and 4 μL 10 μM Close solution (①), 4 μL 10 μM Close solution and 4 μL 10 μM Anti-Close solution (②), 4 μL 10 μM Bridge solution and 4 μL 10 μM Open solution (③), 4 μL 10 μM Open solution and 4 μL 10 μM Anti-Open solution (⑤), 4 μL 10 μM Latch X,Y solution and 4 μL 10 μM Bridge solution (⑥), were mixed separately with 12.5 mM MgCl2 buffer, and 1 μL mQ to make Samples ①-⑥. Samples ①-⑥ were incubated for 30 mins, in 25 ℃.
- After incubation, 5 μL of Sample ⑥ and 2.4 μL 10 μM Close solution were mixed with 12.5 mM MgCl2 buffer, and mQ to make Sample ⑦. Sample ⑦ was incubated for 30 mins, in 25 ℃.
- After incubation, 5 μL of Sample ⑦ and 2 μL 10 μM Anti-Close strand solution were mixed with 12.5 mM MgCl2 buffer, and mQ to make Sample ⑧. Sample ⑧ was incubated for 30 mins, in 25 ℃.
- After incubation, 8 μL of Sample ⑧ and 0.96 μL 10 μM Open solution were mixed with 12.5 mM MgCl2 buffer, and mQ to make Sample ⑨. Sample ⑨ was incubated for 30 mins, in 25 ℃.
- After incubation, 5 μL of Sample ⑨ and 0.72 μL 10 μM Anti-Open solution were mixed with 12.5 mM MgCl2 buffer, and mQ to make Sample ⑩. Sample ⑩ was incubated incubated for 30 mins, in 25 ℃.
(The concentration ratio of Latch X, Y : Close : Anti-Close = 1:1.2:2, and Bridge:Open:Anti-Open=1:1.4:1.8)
After incubation, Sample ①-⑩ were mixed with 1×loading buffer, 12.5 mM MgCl2 buffer, and mQ for the later polyacrylamide gel electrophoresis (100 V, 80 mins, 4 ℃).
Purification of Unit, Latch, Bridge and Electrophoresis of DNA Origami Units (Supplementary Experiment 4.)
2.25 μL 400 nM M13 solution, 24.3 μL 185 nM staples solution, 0.27 μL 5000 nM Bridge solution, 3 μL 125 mM MgCl2 buffer and mQ were mixed to make annealing mixture. Annealing mixture was annealed following the protocol below. Annealed mixture was obtained after 16 hrs. \begin{align} &85℃ \xrightarrow{5 \ min} 65℃ \xrightarrow{15 \ min} 60℃ \xrightarrow{-1℃/1hour} 44℃ \xrightarrow{automatic} 25℃ \end{align}
After annealing, Amico pro purification was performed by the following procedures.
- 0.15 mL 1 M Tris-HCl (pH=8), 0.06 mL 0.5 M EDTA, 0.045 mL 1M MgCl2 buffer, 29.745 mL mQ were mixed to make 30 mL ① buffer.
- 0.005 mL 1M Tris-HCl, 0.002 mL 0.5 M EDTA, 0.5 mL 1M MgCl2, 0.493 mL mQ were mixed to make 1 mL ② buffer.
- 10 µL annealed sample and 490 µL mQ were mixed and poured into a 100K filter. The filter was put into a tube.
- High Speed Micro Refrigerated Centrifuge (KUBOTA corporation) was used to rotate the filter in 4500 rpm, 5 mins, 4℃.
- The filter was reversed and transferred to a new tube.
- High Speed Micro Refrigerated Centrifuge (KUBOTA corporation) was used to rotate the filter in 1000 rpm, 2 mins, 4℃.
- The sample remained in tube was extracted into a new tube. Certain volume of ① buffer was added to keep the total volume to 500 µL.
- Procedure 4, 5, 6, 7 were repeated 3 times.
- Certain volume of ② buffer was added to adjust the sample to the original concentration.
Later, to check the yield by purification, Agarose gel electrophoresis was performed as follows.
0.8% Agarose gel electrophoresis
- 10 mL 5×TBE buffer, 0.8 g agarose powder (Takara Japan), 4 mL 125mM MgCl2 buffer, 86 mL mQ were mixed to make 100 mL/0.8% gel.
- Mixture was heated by microwave for 30 sec. and solidified for approximately 50 mins, at 25℃.
- Solidified gel was set on electrophoresis chamber (Mupid-2plus, Mupid, JAPAN).
- 50 mL 5×TBE buffer, 2.5 mL 1 M MgCl2 buffer, 447.5 mL mQ were mixed to make 500 mL running buffer and poured into the electrophoresis chamber.
- Annealed mixture and purified mixture were prepared by mixing with 12.5 mM MgCl2 buffer, loading buffer and mQ. Simultaneously, 1×loading ladder solution (20k bps) and 1 nM M13 solution were prepared by mixing with loading buffer and mQ.
- 7 µL of each mixture was applied into each well.
- 100 V of voltage was applied for 50 mins in 4℃.
- Gel was stained by SYBR GOLD for 30 mins.
- Fluorescence was observed by gel imager (ChemiDoc MP, BIO-RAD, USA).
Dimer Formation (Main Experiment 4.1)
First, we prepared the Samples ①-⑦ for annealing by the following procedures.
25 nM unit-left submixture and 25 nM unit-right submixture were prepared for the annealing of dimers.
To examine the optimal linker DNA strand concentration, Linker concentration for Samples ①-⑦ were adjusted to ①10 nM, ②15 nM, ③20 nM, ④25 nM, ⑤30 nM, ⑥35 nM, ⑦40 nM each as a gradient.
The final concentration of Samples ①-⑦ for annealing are shown in Table 10 below.
| Sample | ① | ② | ③ | ④ | ⑤ | ⑥ | ⑦ |
|---|---|---|---|---|---|---|---|
| Unit-left / nM | 10 | 10 | 10 | 10 | 10 | 10 | 10 |
| Unit-right / nM | 10 | 10 | 10 | 10 | 10 | 10 | 10 |
| Linker / nM | 10 | 15 | 20 | 25 | 30 | 35 | 40 |
| MgCl2 buffer / nM | 12.5 | 12.5 | 12.5 | 12.5 | 12.5 | 12.5 | 12.5 |
The sample was annealed following the protocol below. Annealed mixture was obtained after 150 mins. \begin{align} &40℃(1 \ min \ hold) \xrightarrow 25℃ (-0.1℃/1 \ min) \end{align} After annealing, Samples ①-⑦ were mixed with 1×loading buffer, 12.5 mM MgCl2 buffer, and mQ for the later electrophoresis. Agarose gel electrophoresis was performed later (100 V, 50 mins, 4 ℃).
Integrated System: Confirmation of Strand Mechanism by Polyacrylamide Gel Electrophoresis (Discussion Experiment 3)
To examine confirm the strand mechanisms for the integrated system and confirm the optimal concentration for hybridization between Actuator+Close with Signal and Actuator+Close with Anti-signal, we designed two experiments for Polyacrylamide gel electrophoresis.
Signal Concentrations (Discussion Experiment 3.1)
Actuator+Close:Signal
- 16 μL 10 μM Actuator solution, 16 μL 10 μM Close solution, 4 μL 125 mM MgCl2 buffer and mQ were mixed to make 40 μL 4 μM Actuator + Close Sample ①. Sample ① was incubated for 30 mins, in 25 ℃.
- After incubation, 2.5 μL Sample ①, 1 μL 10 μM Signal solution, 1μL 125 mM MgCl2 buffer, and 5.5 μL mQ were mixed to make Sample ②. Sample ② was incubated for 30 mins, in 25 ℃. (Actuator + Close:Signal = 1:1)
- 2.5 μL mixture ①, 1.2 μL 10 μM Signal solution, 1μL 125 mM MgCl2 buffer, and 5.3 μL mQ were mixed to make Sample ③. Sample ③ was incubated for 30 mins, in 25 ℃. (Actuator + Close:Signal = 1:1.2)
- 2.5 μL mixture ①, 1.5 μL 10 μM Signal solution, 1μL 125 mM MgCl2 buffer, and 5.0 μL mQ were mixed to make Sample ④. Sample ④ was incubated for 30 mins, in 25 ℃. (Actuator + Close:Signal = 1:5)
- 2.5 μL mixture ①, 1 μL 10 μM Signal solution, 1μL 125 mM MgCl2 buffer, and 4.5 μL mQ were mixed to make Sample ⑤. Sample ⑤ was incubated for 30 mins, in 25 ℃. (Actuator + Close:Signal = 1:2.0)
- 2.5 μL mixture ①, 1 μL 10 μM Signal solution, 1μL 125 mM MgCl2 buffer, and 4.3 μL mQ were mixed to make Sample ⑥. Sample ⑥ was incubated for 30 mins, in 25 ℃. (Actuator + Close:Signal = 1:2.2)
- 2.5 μL mixture ①, 1 μL 10 μM Signal solution, 1μL 125 mM MgCl2 buffer, and 4.0 μL mQ were mixed to make sample ⑦. Sample ⑦ was incubated for 30 mins, in 25 ℃. (Actuator + Close:Signal = 1 : 2.5)
- The detailed concentration ratios were set up as Table 11 shown below.
| Concentration ratio | |||||||
|---|---|---|---|---|---|---|---|
| Sample | ① 1:1 | ② 1:1.2 | ③ 1:1.5 | ④ 1:2.0 | ⑤ 1:2.2 | ⑥ 1:2.5 | |
| Actuator / μM | 1 | 1 | 1 | 1 | 1 | 1 | |
| Close / μM | 1 | 1 | 1 | 1 | 1 | 1 | |
| Signal / μM | 1 | 1.2 | 1.5 | 2.0 | 2.2 | 2.5 | |
| MgCl2 buffer / mM | 12.5 | 12.5 | 12.5 | 12.5 | 12.5 | 12.5 | |
Samples ②-⑦ were incubated for 30 mins, in 25 ℃.
After incubation, Samples ①-⑦ were mixed with 1× loading buffer, 12.5 mM MgCl2 buffer, and mQ for the later electrophoresis. Polyacrylamide gel electrophoresis was performed later (100 V, 80 mins, 4 ℃).
Anti-Signal Concentrations (Discussion Experiment 3.2)
Actuator + Close + Signal + Anti-Signal
- 8 μL 10 μM Actuator solution, 8 μL10 μM Close solution, 2 μL 125 mM MgCl2 buffer and 2 μL mQ were mixed to make 20 μL 4 μM Actuator + Close mixture ①. The mixture ① was incubated for 30 mins, in 25 ℃. (Actuator:Close = 1:1)
- 10 μL mixture ①, 4.8 μL 10 μM Signal solution, 4μL 125 mM MgCl2 buffer and 21.3 μL mQ were mixed to make Sample ①. Sample ① was incubated for 30 mins, in 25 ℃. (Actuator:Close:Signal = 1:1:1.2)
- After incubation, 2.5 μL Sample ①, 0.3 μL 1 μM Anti-Signal solution, 1μL 125 mM MgCl2 buffer, and 3.5 μL mQ were mixed to make Sample ②. Sample ② was incubated for 30 mins, in 25 ℃. (Actuator:Close:Signal:Anti-Signal = 1:1:1.2:1.2)
- 2.5 μL mixture ①, 0.5 μL 10 μM Anti-Signal DNA strand solution, 1μL 125 mM MgCl2 buffer, and 6 μL mQ were mixed to make Sample ③. Sample ③ was incubated for 30 mins, in 25 ℃. (Actuator : Close : Signal : Anti-Signal = 1:1:1.2:2)
- 2.5 μL mixture ①, 0.625 μL 10 μM Anti-Signal solution, 1μL 125 mM MgCl2 buffer, and 5.875 μL mQ were mixed to make Sample ④. Sample ④ was incubated for 30 mins, in 25 ℃. (Actuator:Close:Signal:Anti-Signal = 1:1:1.2:2.5)
- 2.5 μL mixture ①, 0.75 μL 10 μM Anti-Signal DNA solution, 1μL 125 mM MgCl2 buffer, and 5.75 μL mQ were mixed to make Sample ⑤. Sample ⑤ was incubated for 30 mins, in 25 ℃. (Actuator:Close:Signal:Anti-Signal =1:1:1.2:3)
- 2.5 μL mixture ①, 0.875 μL 10 μM Anti-Signa solution, 1μL 125 mM MgCl2 buffer, and 5.625 μL mQ were mixed to make Sample ⑥. Sample ⑥ was incubated for 30 mins, in 25 ℃. (Actuator:Close:Signal:Anti-Signal = 1:1:1.2:3.5)
- 2.5 μL mixture ①, 1 μL 10 μM Anti-Signal solution, 1μL 125 mM MgCl2 buffer, and 5.5 μL mQ were mixed to make Sample ⑦. Sample ⑦ was incubated for 30 mins, in 25 ℃. (Actuator:Close: Signal:Anti-Signal = 1:1:1.2:4)
- 2.5 μL mixture ①, 1.125 μL 10 μM Anti-Signal solution, 1μL 125 mM MgCl2 buffer, and 5.375 μL mQ were mixed to make Sample ⑧. Sample ⑧ was incubated for 30 mins, in 25 ℃. (Actuator:Close:Signal:Anti-signal = 1:1:1.2:4.5)
- The detailed concentration ratios were set up as Table 12 shown below.
| Concentration ratio | ||||||||
|---|---|---|---|---|---|---|---|---|
| Sample | ① | ② | ③ | ④ | ⑤ | ⑥ | ⑦ | ⑧ |
| Actuator / μM | 1 | 1 | 1 | 1 | 1 | 1 | 1 | 1 |
| Close / μM | 1 | 1 | 1 | 1 | 1 | 1 | 1 | 1 |
| Signal / μM | 1.2 | 1.2 | 1.2 | 1.2 | 1.2 | 1.2 | 1.2 | 1.2 |
| Anti-Signal / μM | 0 | 1.2 | 2 | 2.5 | 3 | 3.5 | 4 | 4.5 |
| MgCl2 buffer / mM | 12.5 | 12.5 | 12.5 | 12.5 | 12.5 | 12.5 | 12.5 | 12.5 |
Sample ②-⑧ were incubated for 30 mins, in 25 ℃. After incubation, Samples ①-⑧ were mixed with 1×loading buffer, 12.5 mM MgCl2 buffer, and mQ for the later electrophoresis. Polyacrylamide gel electrophoresis was performed later (100 V, 80 mins, 4 ℃).
Integrated System: Confirmation of DNA Origami Unit by Agarose Gel Electrophoresis (Discussion Experiment 3.3)
We prepared the annealing Samples ⑥ and ⑦ by standard procedures as follows.
Sample ⑥ was prepared and annealed by mixing 7 µL of Sample ② annealed in Experiment 1 with 2 µL of 500 nM actuator-DNA, 2 µL of 500 nM close-DNA, 2 µL of 12.5 nM of MgCl2 buffer and 7 µL of mQ.
Sample ⑦ was prepared and annealed by mixing 7 µL of Sample ② annealed in Experiment 1, with 2 µL of 12.5 mM MgCl2 buffer and 11 µL of mQ.
Final annealing concentrations for Samples ⑥ and Samples ⑦ are shown in Table 13 below.
| Sample ⑥ (with actuator-DNA + close-DNA) |
Sample ⑦ (without actuator-DNA + close-DNA) |
|
| M13 | 10 nM | 10 nM |
| Staple | 50 nM | 50 nM |
| Actuator | 50 nM | 0 nM |
| Close | 50 nM | 0 nM |
| Buffer | 1 × | 1 × |
For electrophoresis, 1 µL of each annealed Sample ⑥ and Sample ⑦ were mixed with 1 µL of 12.5 mM MgCl2 buffer, 1 µL of 10×Loading buffer and 7 µL of mQ.
Final electrophoresis concentrations for Samples ⑥ and Samples ⑦ are shown in Table 14 below.
| Reagent | Concentration | |
|---|---|---|
| Sample ⑥ (actuator-DNA + close-DNA) |
Sample ⑦ (actuator-DNA + close-DNA) |
|
| M13 scaffold | 10 nM | 10 nM |
| Staple | 50 nM | 50 nM |
| actuator-DNA | 50 nM | 0 nM |
| close-DNA | 50 nM | 0 nM |
| Loading buffer | 1 × | 1 × |
| Buffer(Mg2+ 12.5mM) | 1 × | 1 × |
Samples ⑥ and ⑦, along with 1× ladder solution and 1 nM M13 solution were prepared and added to the wells. Gel electrophoresis was performed and structures were observed.
AFM
Mg2+ concentration for DNA Origami (Main Experiment 1.2.)
According to results of Main Experiment 1.1., we selected Sample ② and diluted it 10 times by 12.5 mM MgCl2 buffer for AFM observation.
Integrated system (Discussion Experiment 3.4)
Since the sample was overly diluted in Main Experiment 1.2, we were only able to observe several structures by AFM. Thus, for Experiment Ⅳ, we diluted the samples 5 times instead of 10 times by 12.5mM MgCl2 buffer for AFM observation.
TEM
Lock Structure (Main Experiment 2)
According to results of Experiment 3, we selected Sample ①, ④, ⑤, ⑫ for TEM observation. 5 μL of each sample was rinsed by 20 μL 0.2% Phosphotungstic acid-0.5N NaOH (pH = 7.3) and 60 μL 12.5 mM MgCl2 buffer.
DNA Origami Open/Close Mechanisms (Main Experiment 4)
According to results of Supplementary Experiment 4, 5 μL of purified mixture was rinsed by 20 μL 0.2% Phosphotungstic acid-0.5N NaOH (pH = 7.3) and 60 μL 12.5 mM MgCl2 buffer.
Dimer Formation (Main Experiment 4.2)
According to results of Main Experiment 5.1, 5 μL of Sample ② was rinsed by 20 μL 0.2% Phosphotungstic acid-0.5N NaOH (pH = 7.3) and 60 μL 12.5 mM MgCl2 buffer.
Analysis
Closed state
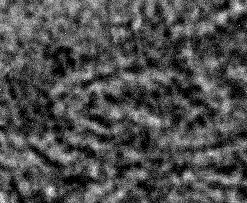
Fig.1 TEM image of a closed unit
Load the TEM images into image J, and set the scale to 2048 pixels/808.09 nm = 2.5344 (pixels/nm). Set the threshold so that it is possible to differentiate between the background and the outline of the target. The Upper length and Lower Length are measured as shown in Fig.2 below.
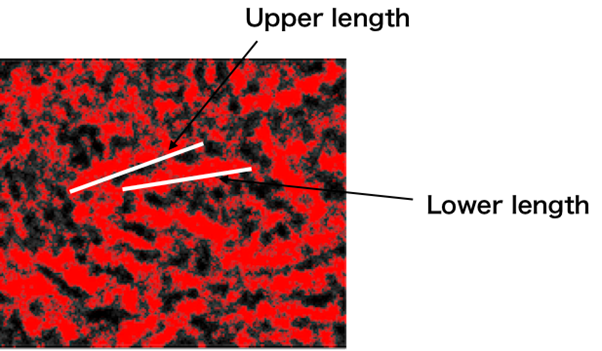
Fig.2 How to measure the lengths of a closed unit
Open state
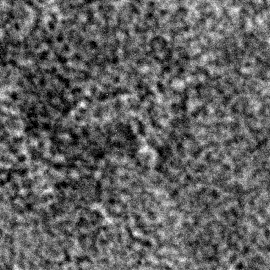
Fig.3 TEM image of an open unit
Load the TEM images into image J, and set the scale to 2048 pixels/808.09 nm = 2.5344 (pixels/nm). Set the threshold so that it is possible to differentiate between the background and the outline of the target. The Minor length and Major Length are measured as shown in Fig.4 below
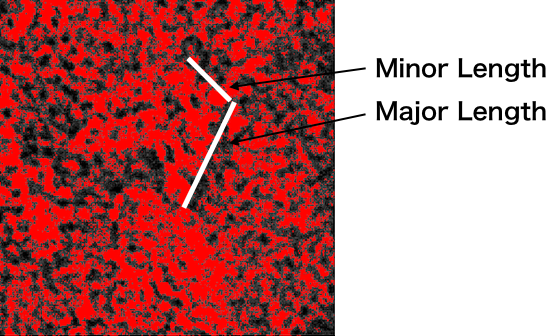
Fig.4 How to measure the lengths of an open unit
About 20 TEM images were measured, and Average, Minimum, Maximum, and Standard deviation were calculated.
Materials
Each materials were purchased from companies below.
| Materials | Company |
|---|---|
| M13mp18 | TAKARA , JAPAN |
| Agarose | TAKARA,JAPAN |
| SYBR gold | Thermo Fisher Scientific, USA |
| MgCl2・6H2O | Wako Pure Chemical Industries, JAPAN |
| 10×loading buffer | TAKARA , JAPAN |
| 20 bp Ladder | TAKARA , JAPAN |
| 100 bp Ladder | Bristol-Myers Squibb, USA |
| 1 kbp Ladder | NIPPON GENE, JAPAN |
| EDTA | Thermo Fisher Scientific, USA |
| Tris-HCl | NIPPON GENE, JAPAN |
| 5×TBE | NIPPON GENE, JAPAN |
| TEMED | BIO-RAD, USA |
| DNA strands | DNA strands Eurofins Genomics, JAPAN Integreted DNA technologies, USA |
Equipment
Each equipment was purchased from companies below.
| Equipments | Company |
|---|---|
| ChemiDoc MP (gel imager) | BIO-RAD, USA |
| Mastercycler pernonal (thermal cycler) | Eppendorf, USA |
| BIoSpec-nano | SHIMADZU CORPORATION, JAPAN |
| Mupid-exU | TAKARA, JAPAN |
| Mild Mixer SL-36 | TAITEC, JAPAN |
| Zetasizer Nano ZSP | Malvern, UK |
| Olympus IX 81 | OLYMPUS, JAPAN |
| Nano Live Vision (AFM) | RIBM, JAPAN |
| Mica | Furuuchi Chemical Corporation, JAPAN |
| Micro Cantilever | OLYMPUS, JAPAN |
DNA sequences(.pdf) Download >> Main >> Supplementary information