1. Mg2+ concentration for DNA Origami
1.1 Electrophoresis
Purpose
To determine the optimal Mg2+ concentration condition for annealing the DNA Origami Panels of our design, samples of different Mg2+ concentration conditions were observed by Agarose Gel Electrophoresis.
Results and Discussion
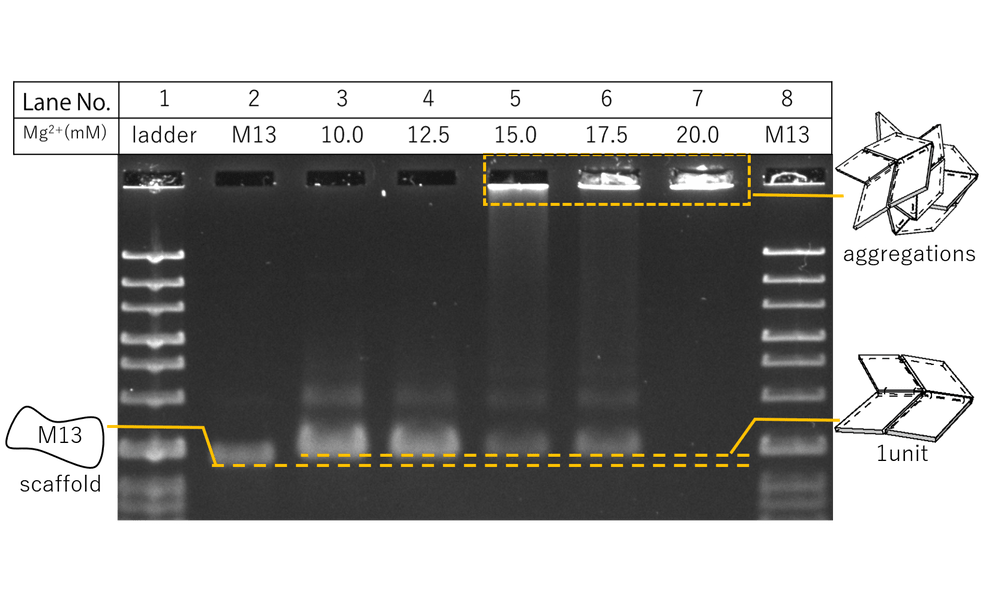
Fig.1 Agarose gel electrophoresis for Mg2+ conditions
Results are shown in Fig.1. The samples were prepared according to the table, where Mg2+ concentration conditions were adjusted from 10 to 20 mM for Lanes 3 to 7. Compared to Lane 2, a band shift was seen for Lanes 3 to 7, indicating the formation of larger structures, assumably our designed panels. The smeared bands at the bottom of the lanes are thought to be the staples. Between Lanes 3 to 7, Lane 4 of 12.5 nM Mg2+ showed the clearest bands for the panels. For Lanes 5 to 7, larger structures were seen to form near the wells, supposedly representing aggregations of the DNA Panels. This is thought to be due to higher salt concentrations causing lower static repulsions between the panels. Thus, the optimal Mg2+ concentration condition was told to be 12.5 nM.
1.2 AFM
Purpose
To further confirm that the DNA Origami structures are formed properly under the Mg2+ concentration condition obtained in 1.1, we diluted the 12.5 mM Mg2+ sample by 10 times and observed it under AFM.
Results and Discussion
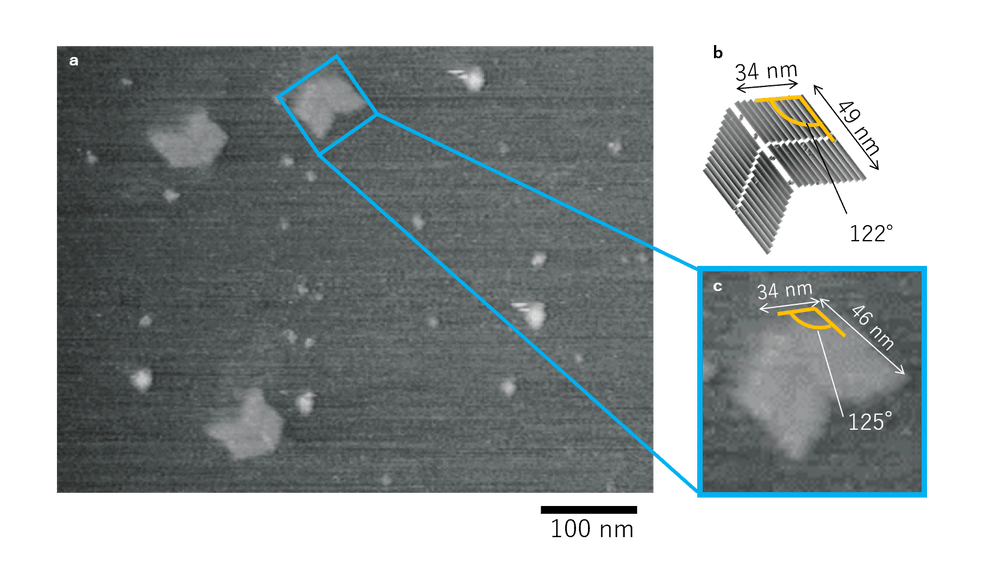
Fig.2 AFM results of 12.5 mM Mg2+ conditions
From the AFM results of Fig.2, we could see proper formation of DNA Origami panels in their opened states. Thus, the Mg2+ concentration of 12.5 mM was thought to be feasible. Also, since only few structures were observed due to over-dilution, for later AFM observations, we decided to dilute the samples by 5 times instead of 10.
2. 0.8% Electrophoresis of Origami with Lock
Purpose
To confirm the Closed state of the Miura folding units, samples of DNA Origami units with Lock strands designed specifically for this purpose were observed using 0.8% Agarose Gel Electrophoresis
Results and Discussion
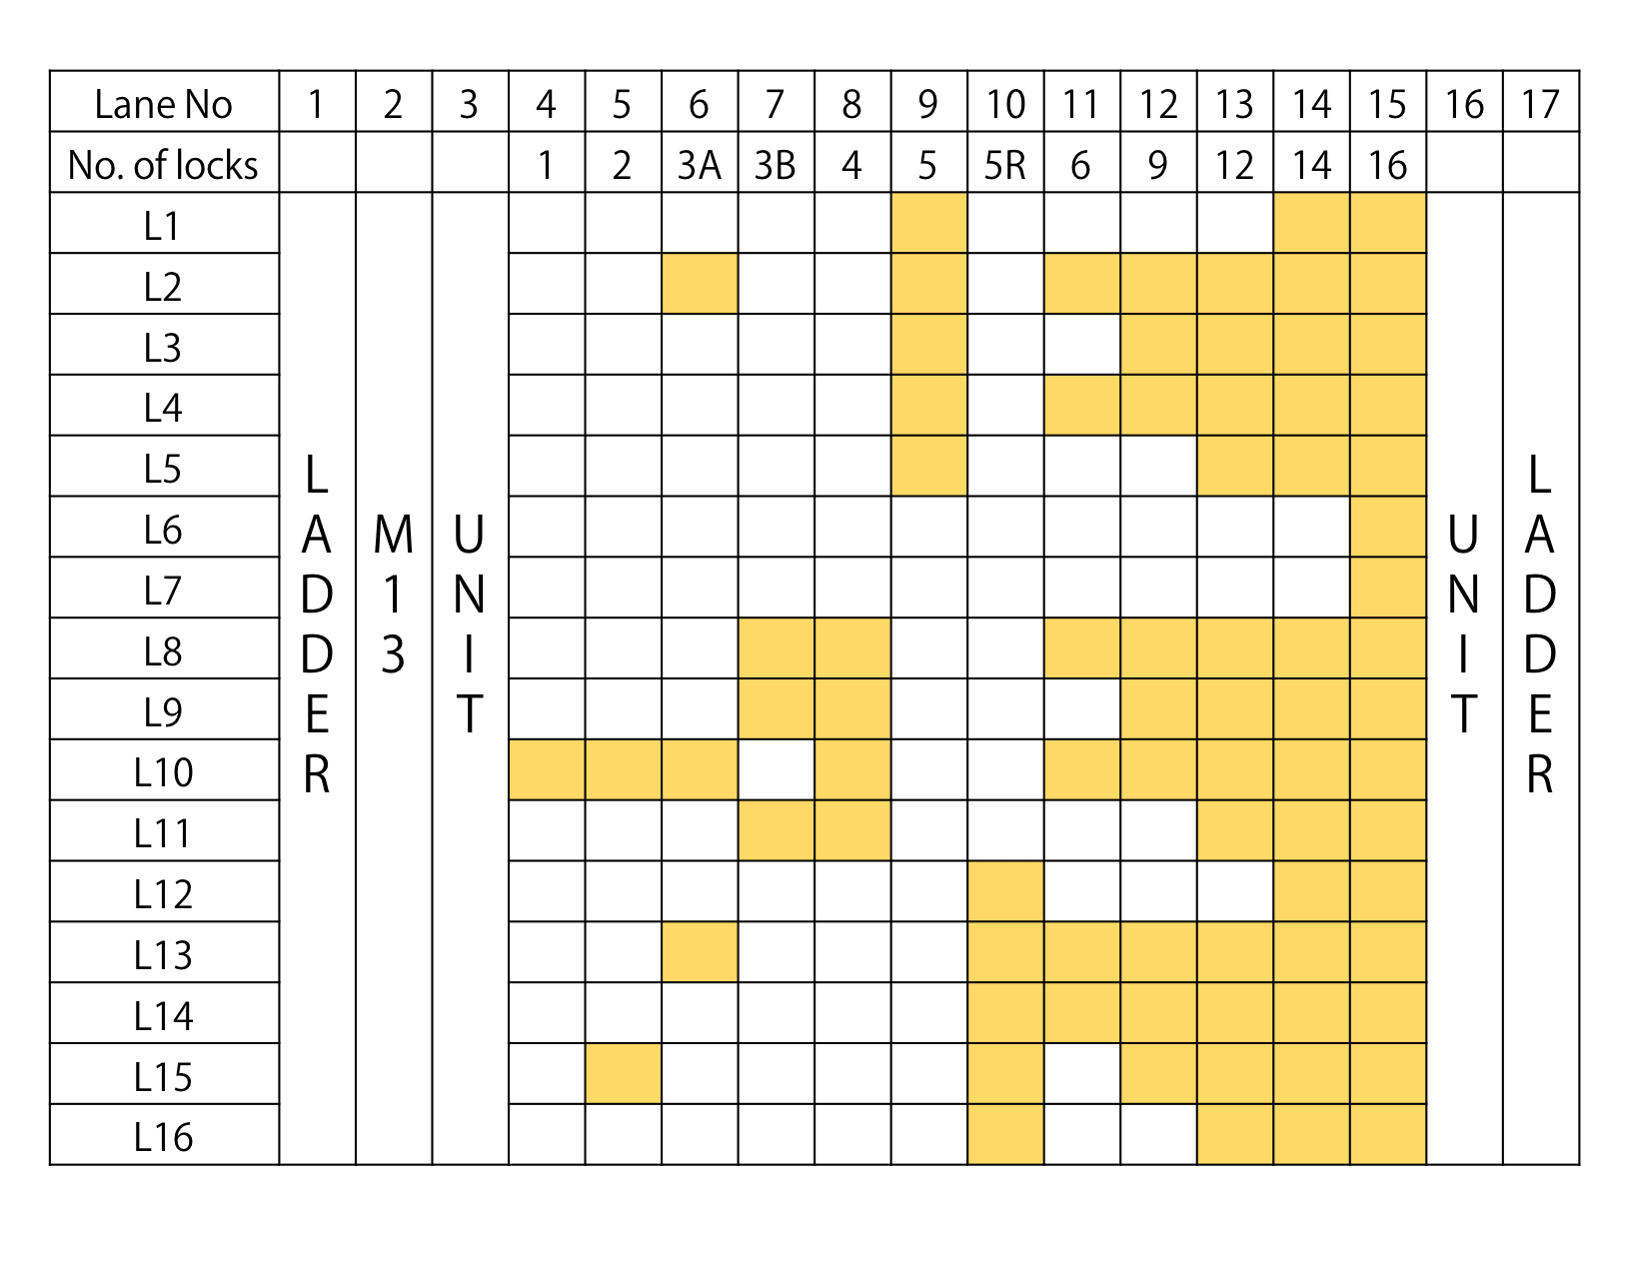
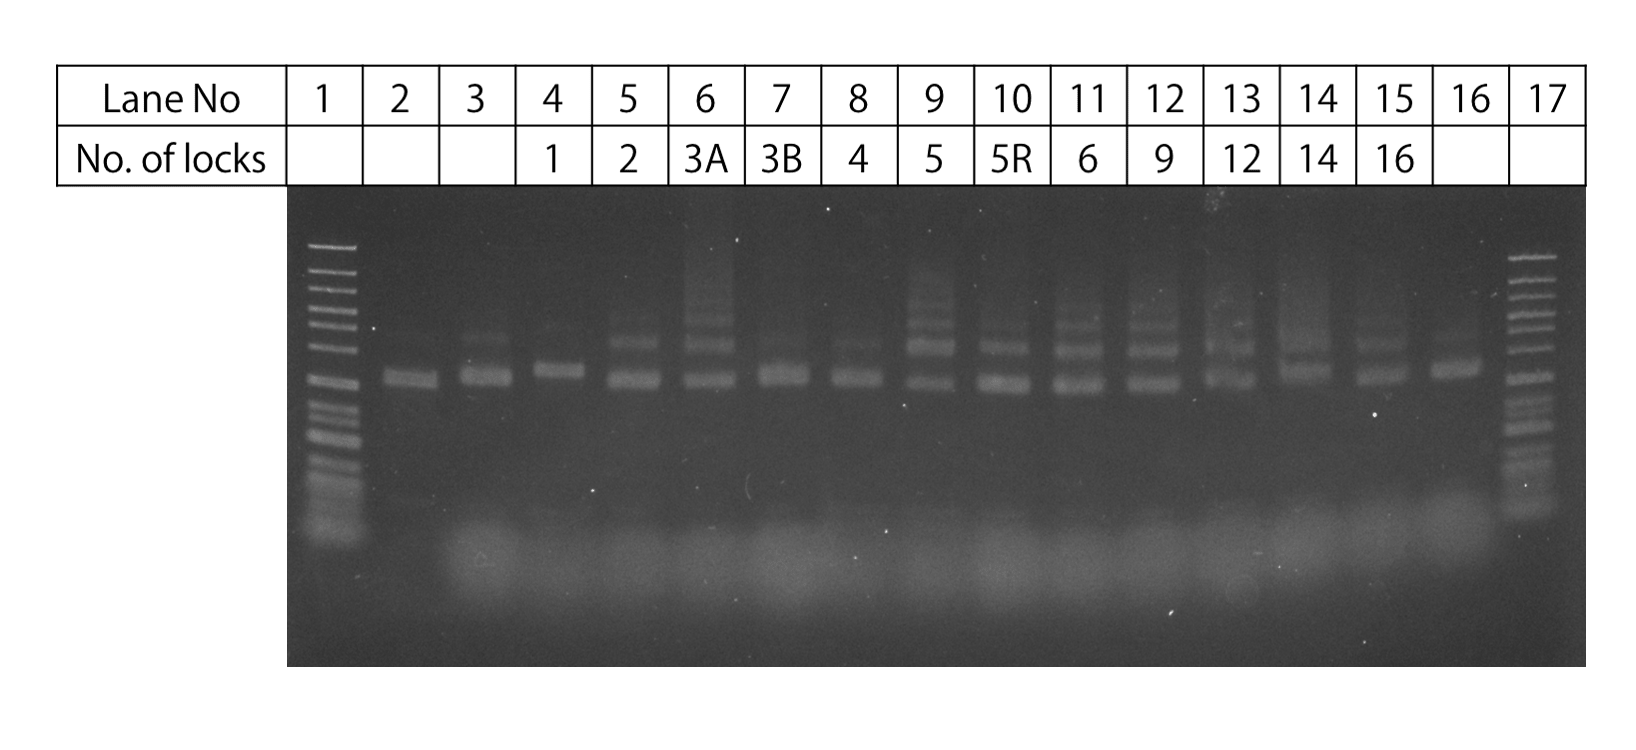
Fig.3 Lock strand electrophoresis
Fig.3 shows the gel electrophoresis results for samples of DNA Origamis with Lock Strands prepared according to the table,. Compared with unit monomers, in the lanes with Lock, the band locations can be seen to stretch further to the wells. The number of these bands rapidly increase from N=2 to 5. This increase suggests that multimers of the DNA Origami units are becoming more easily formed as more Lock strands are inserted. In addition, for samples 3A and 3B, both are of N=3, yet the gel electrophoresis band results were shown to be different, suggesting that the degree of multimer formation is affected by the position the Lock Strand is attached. For the TEM observations, er decided to use the samples of N=1, 3B, 4, and , which had relatively few multimer bands.
3. DNA Strand Mechanism
Purpose
In order to confirm the DNA strand mechanisms, we prepared samples of different combinations of our designed DNA and performed Polyacrylamide gel electrophoresis to observe the formed structures. In addition, the optimal concentration conditions for each of the DNA strands were
3.1. Close concentration Condition
Purpose
The designed Miura Folding units are folded by the three strands, Latch X, Y, and Close, performing hybridizations. In this experiment we will confirm the reactions between the Latch strands and Close as well as their optimum concentration conditions, before the three strands are attached to the DNA Origami, from the results of Acrylamide gel electrophoresis.
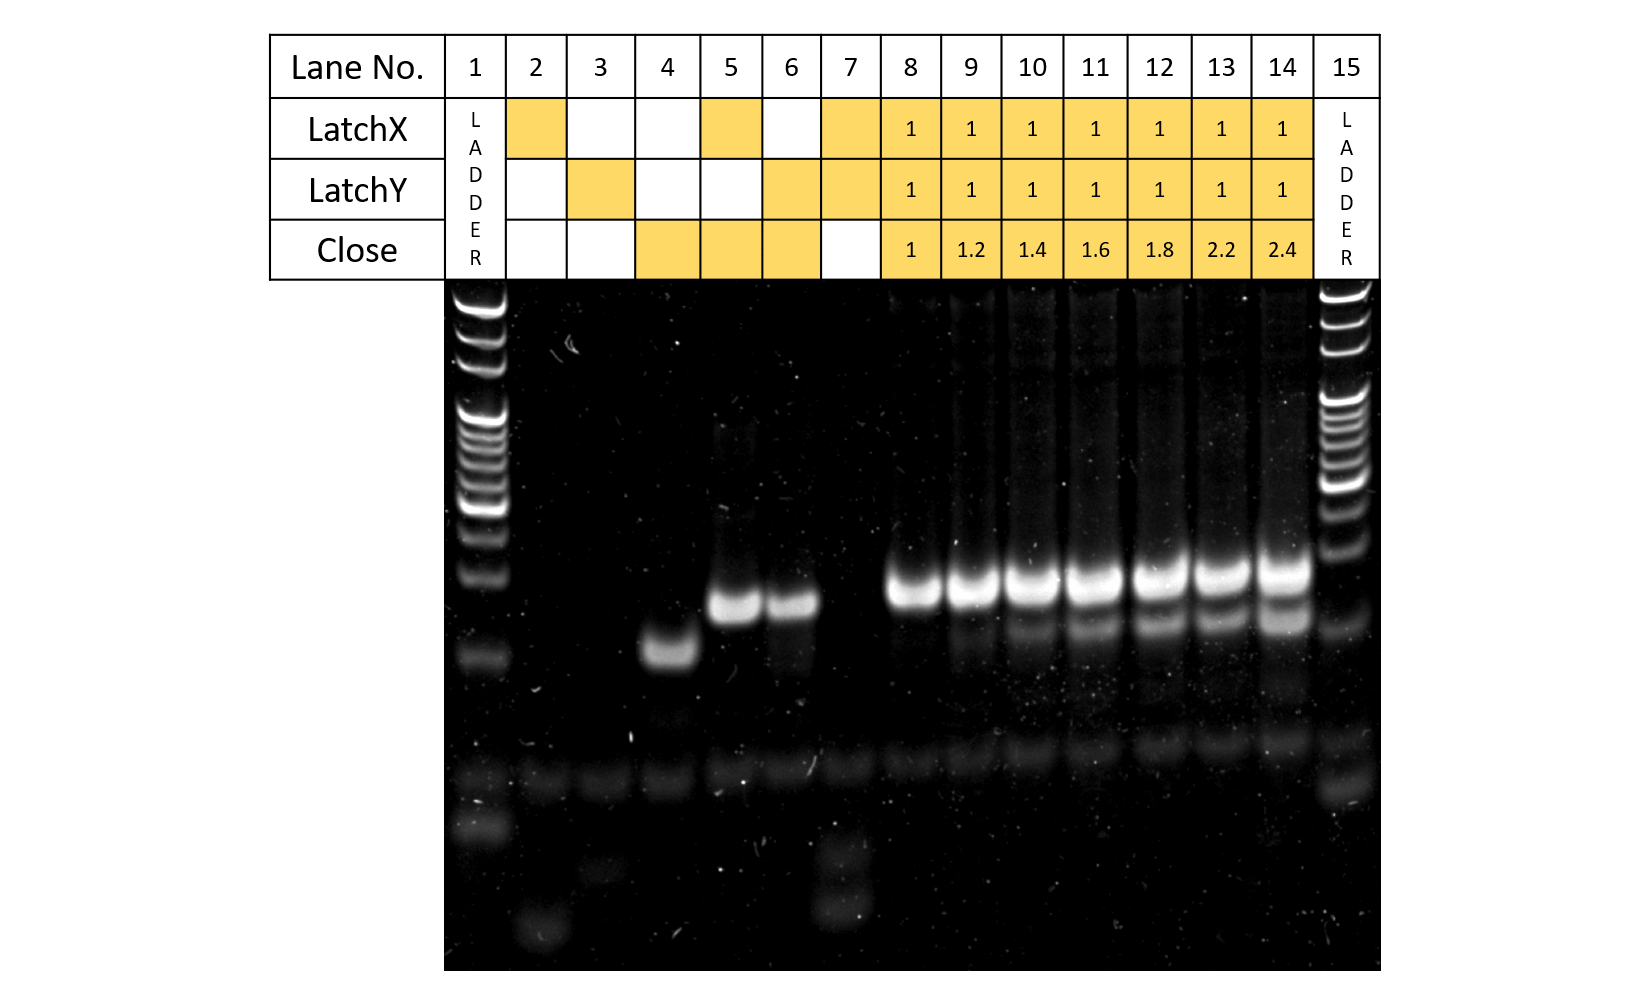
Fig.4 Close concentration
Results and Discussion
Fig. 4 shows the results of electrophoresis where Latch X,Y, and Close were reacted. For Lanes 5 and 6, since new bands are shown to appear compared to results of Lanes 2-4, both Latch X and Y are shown to each react with Close. In addition, in contrast to Lane 7, in Lane 8, since bands for both Latches are shown to disappear upon the addition of Close, Latch and Close can be assumed to be reacting according to design. When the concentration of Close is increased while Latch concentration is set (Lanes 8-14), the band for Close gradually becomes more apparent and clearer, showing that Latch had indeed been reacting with Close. From this experiment, since all of the strands reacted when Latch X , Y, and Close were made to react under concentration ratios of 1:1:1, this would seem to be the optimum concentration condition. However, upon the actual applications of the strands to the DNA Origami, since the reaction rate is thought to decrease as the reaction progresses under concentration conditions of 1:1:1, taking the changes of reaction rates into consideration, we will perform the experiments where the DNA strands are applied to the DNA Origami under the concentrations conditions of LatchX:LatchY:Close=1:1:1.2.
3.2 Anti-Close Concentration Condition
Purpose
From Supplementary Experiment 3.1, Latch and Close were confirmed to react according to design. In this experiment, we will confirm if Anti-Close, which is designed to release the DNA Origami closed by Latch and Close, will properly react with Close according to design, as well as obtain the optimal concentration condition from the Acrylamide gel electrophoresis results.
Results and Discussion
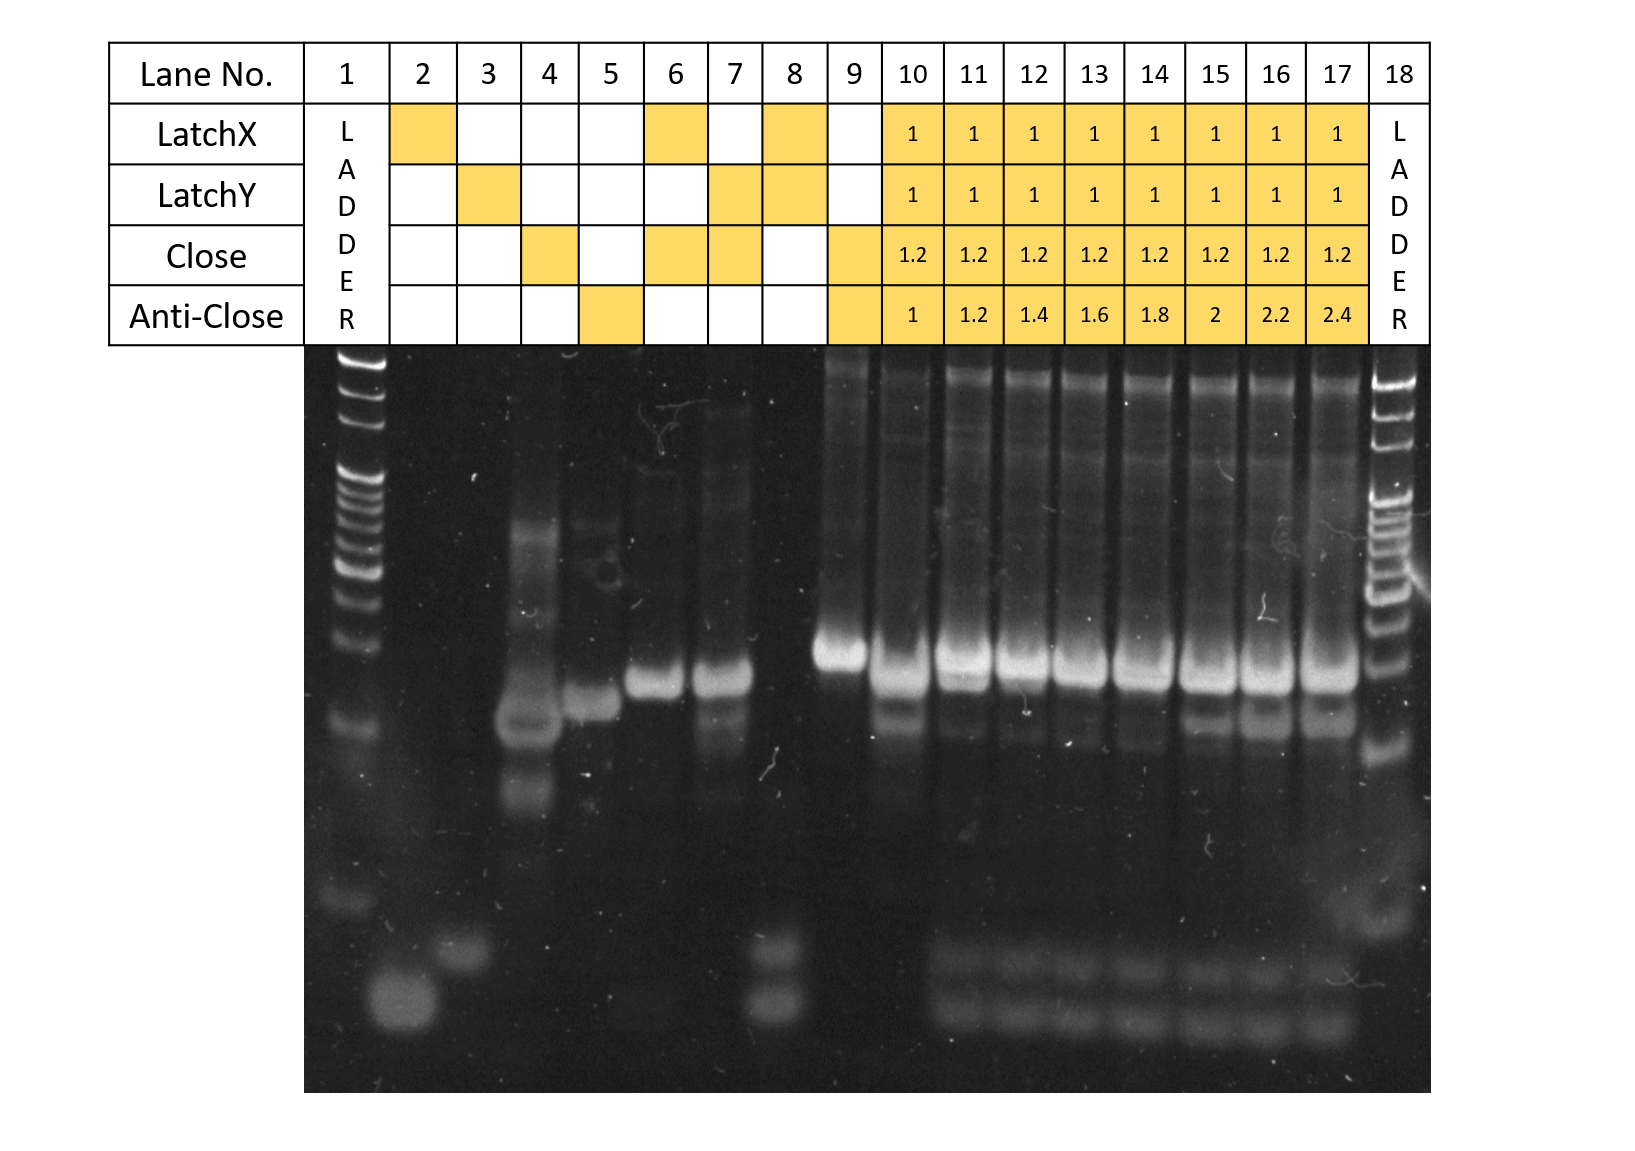
Fig.5 Anti-Close concentration
In Fig. 5. above, the electrophoresis results for when the 4 types of strands: Latch X, Y, Close, and Anti-Close, are reacted according to the concentration ratios shown in the table. Here, Latch X, Y, and Close are reacted under concentration ratio conditions of 1:1:1.2, receiving the results of Experiment 3 (Supplementary). Anti-Close was added according to the table while Latch X,Y concentrations were fixed. As seen from the results, for lanes with Close:Anti-Close concentration ratios of 1.2:1.2,1.2:1.4, due to the effect of Anti-Close, although bands of Latch X, Y+Close remain, bands of monomers of Latch X, Y, and Close also can be seen to appear, and under concentration conditions of Close:Anti-Close=1.2:1.6, bands for Latch X, Latch Y+Close have disappeared. Thus, Anti-Close can be concluded to displace Close from Latch X,Y successfully according to design. Also, for the Anti-Close concentrations, from the results of Lanes 11-17, it can be told that Anti-Close concentration becomes excessive when concentrations are higher than that of Close:Anti-Close=1.2:2. Although the optimal concentration for applying the strands to the DNA Origami seem to be around 1.2:1.8, where the reactions fully proceeded, considering the decreases in the reaction rate, future experiments were performed under the concentrations conditions of Latch X:Latch Y:Close:Anti-Close=1:1:1.2:2.
3.3. Open Concentration Conditions
Purpose
From the results of electrophoresis of Supplementary Experiments 3.1 and 3.2, the mechanism to close the DNA Origami is thought to properly function. However our goal is to control the opening and closing of the Miura Folding DNA Origami units. In this experiment, we will confirm if Bridge and Open designed to maintain the Open state of the DNA Origami will react according to our designed mechanism, as well as obtain the optimal concentration condition from gel electrophoresis results.
Results and Discussion
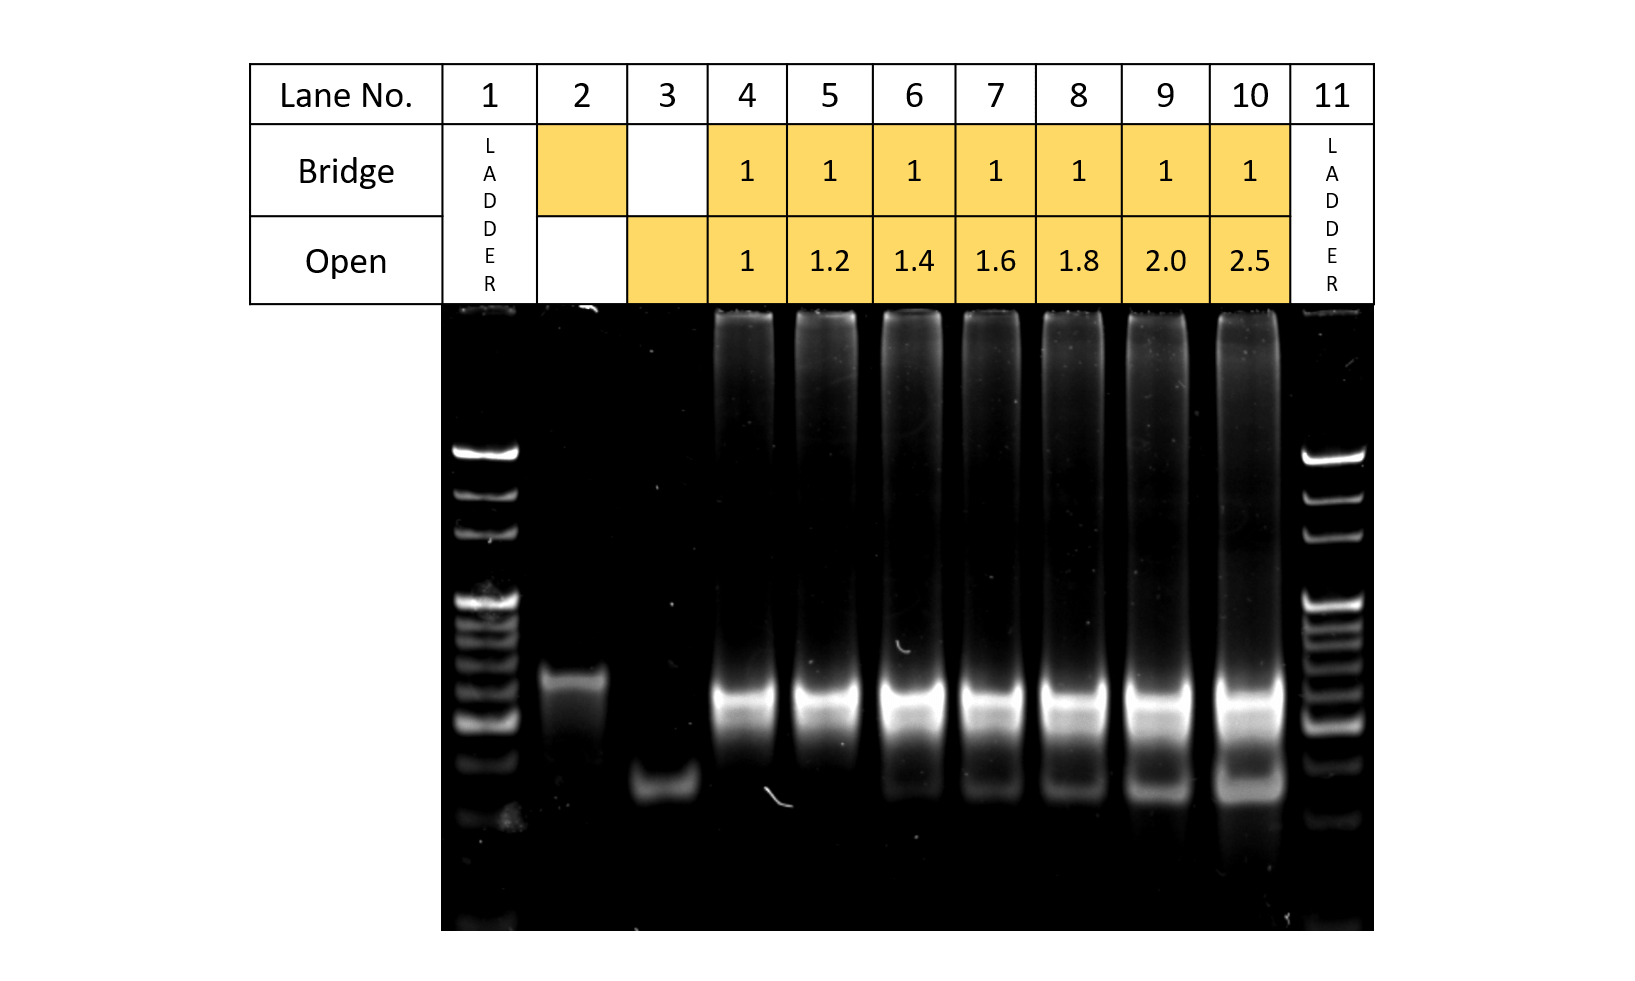
Fig.6 Open concentration
Fig.6 shows the electrophoresis results for when the two sets of strands: Bridge and Open, are made to react according to the table. From Lanes 2,3,an 4 where Bridge and Open are added, since bands can be observed in different locations from that of samples of only Bridge or Open, Bridge and Open can be said to react. In addition, in the lane where Bridge:Open=1:1.4, the excess Open are seen as bands. Thus, taking the reaction rate upon applications to DNA Origamis into account, Bridge:Open was set to 1:1.4.
3.4. Anti-Open Concentration Conditions
Purpose
From Supplementary Experiment 3.3, Bridge and Open were shown to properly react according to design. In this experiment, we will confirm if Anti-Open, which is designed to release and close the DNA Origami held opened by Bridge and Open, will react with Open according to design, as well as find the optimal concentration condition.
Results and Discussion
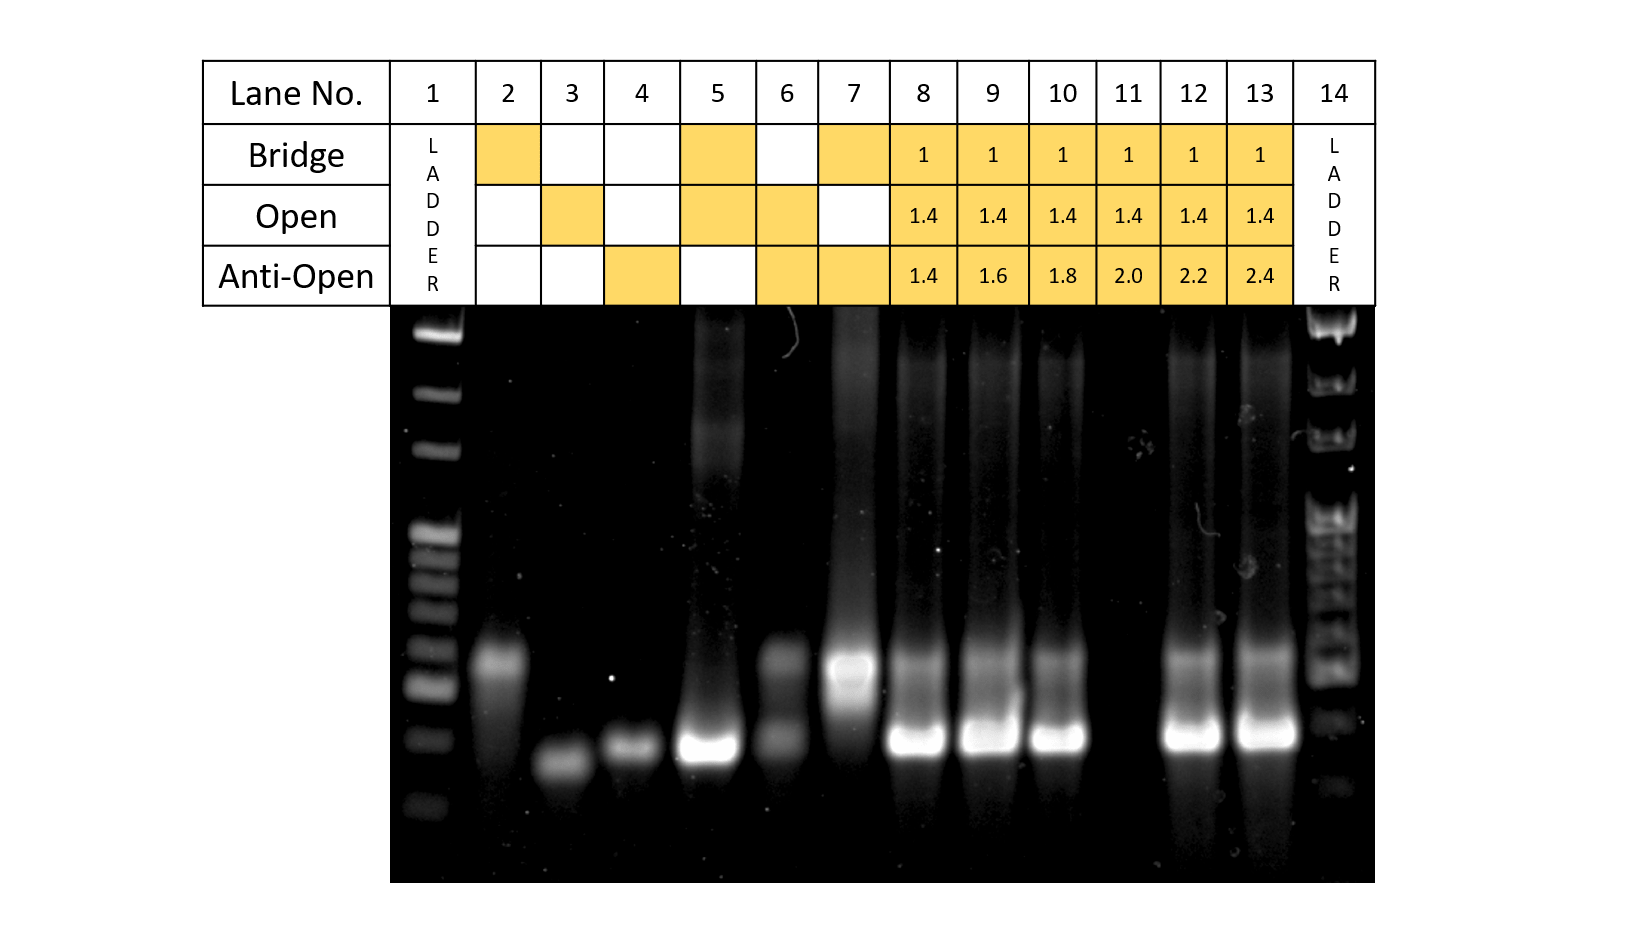
Fig.7 Anti-Open concentration
In Fig.7, the results of gel electrophoresis when the three types of strands: Bridge, Open, and Anti-Open are added according to the table. For all lanes of Bridge:Open:Anti-Open 1:1.4:1.4 to 1:1.4:2.4, the band for Bridge+Open becomes thinner while the band for Signal+Anti-Signal becomes visible. Although we wanted to see from which concentration condition Anti-Open becomes excess, since the bands for Anti-Open and Open+Anti-Open are located around the same height, it is hard to distinguish the two. Also, for Lane of 1:1.8, since the band for Bridge+Open seems to become thinner, for application to DNA Origamis, the future experiments were decided to be Bridge:Open:Anti-open=1:1.4:1.8.
4. Confirmation of DNA Origami Units
4.1 Preliminary Experiments: Purification of Unit, Latch, Bridge
Purpose
Purify Unit, Latch, and Bridge for TEM observations
Results and Discussion
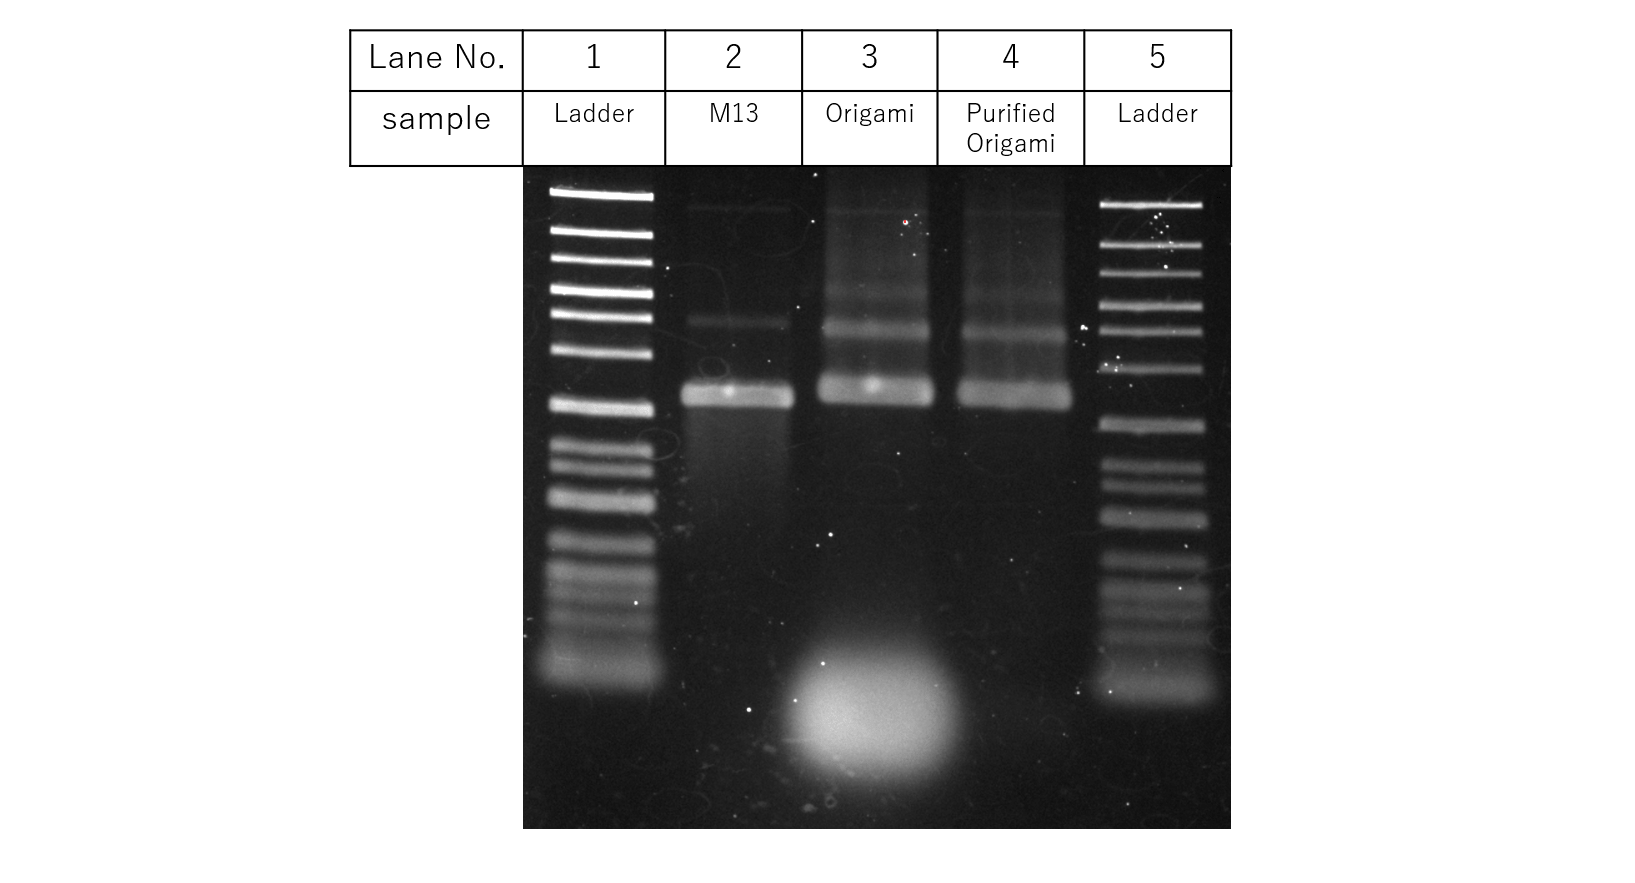
Fig.8 Purification
Fig. 8 shows the results for gel electrophoresis with samples according to the table. Compared to before the purification, It can be seen that excess strands are omitted after the purification process. With this, the following experiments to confirm the DNA Origami Unit mechanisms were performed.
4.2. Confirmation of DNA Origami Units by Gel Electrophoresis
Purpose
DNA strands were added to Miura Folding units made from purified strands in Experiment 4.1., and results were confirmed by gel electrophoresis. In order to further observe the structures by TEM, we confirmed the formation of the Miura Folding Units in the samples with the electrophoresis.
Results and Discussion
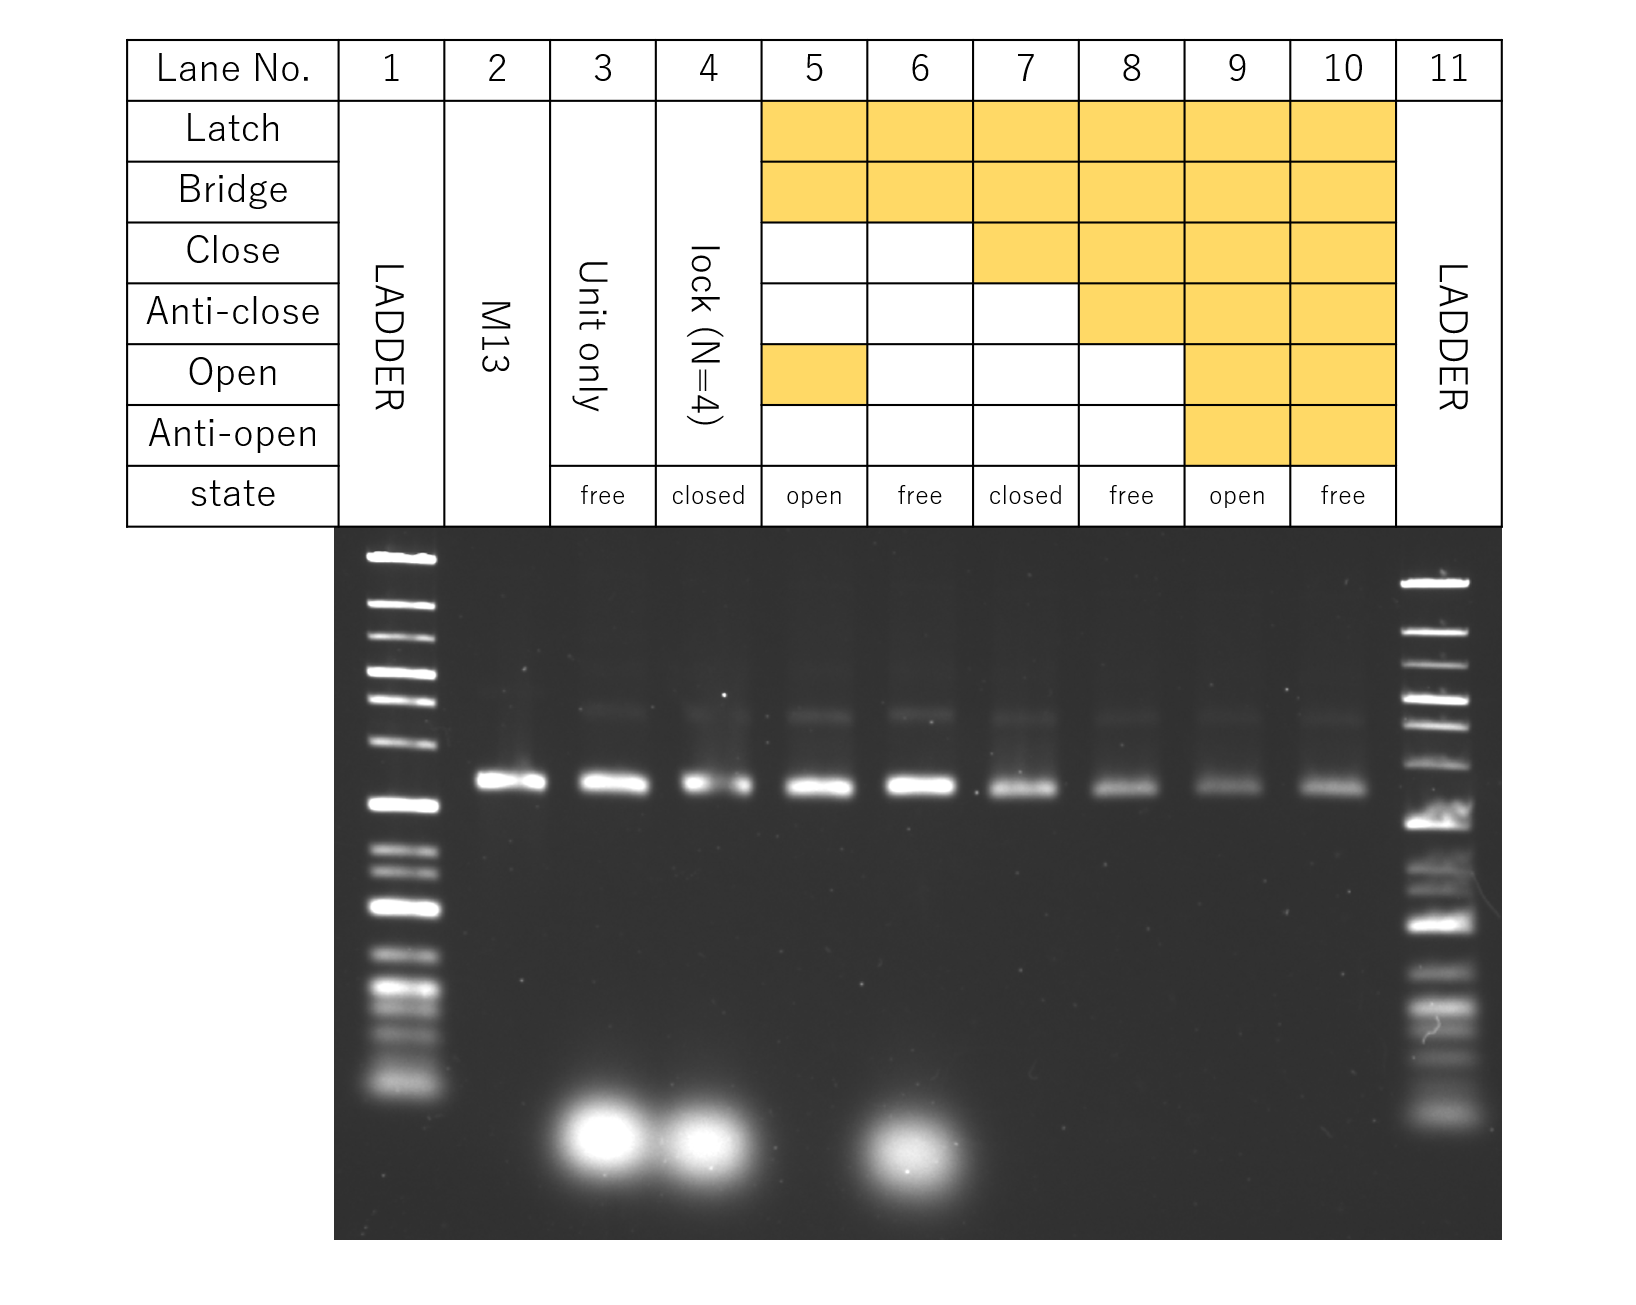
Fig.9 DNA Origami Units
Fig. 9 shows the gel electrophoresis results for the samples with DNA Origami and DNA strands added to the solution according to the table. From the results, since the necessary DNA Origami and DNA strands were confirmed to be in the sample solution, the strands purified in 4.1. were decided to be used for TEM.
4.3 TEM Analysis of DNA Origami Units
Shown below is the data analysis for the TEM results of Main Experiment 4 of our designed Miura-Folding DNA Origami mechanisms.
The yeilds for each of the observed structures for transformation phases ① Neutral_1, ② Close, ③ Neutral_2, ③ Open are shown in Fig.10.
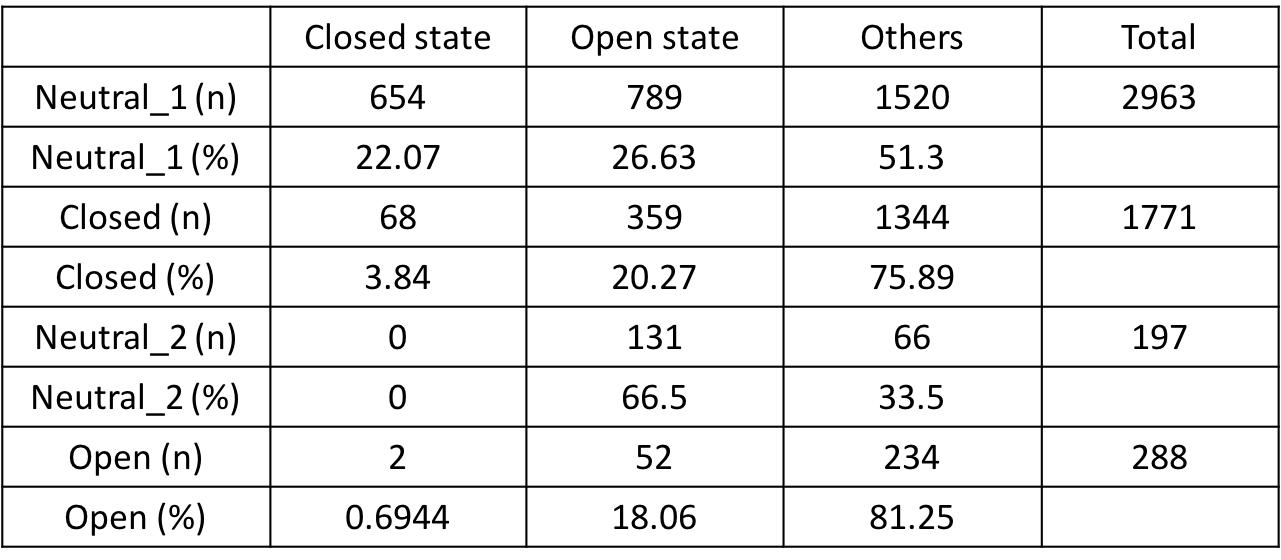
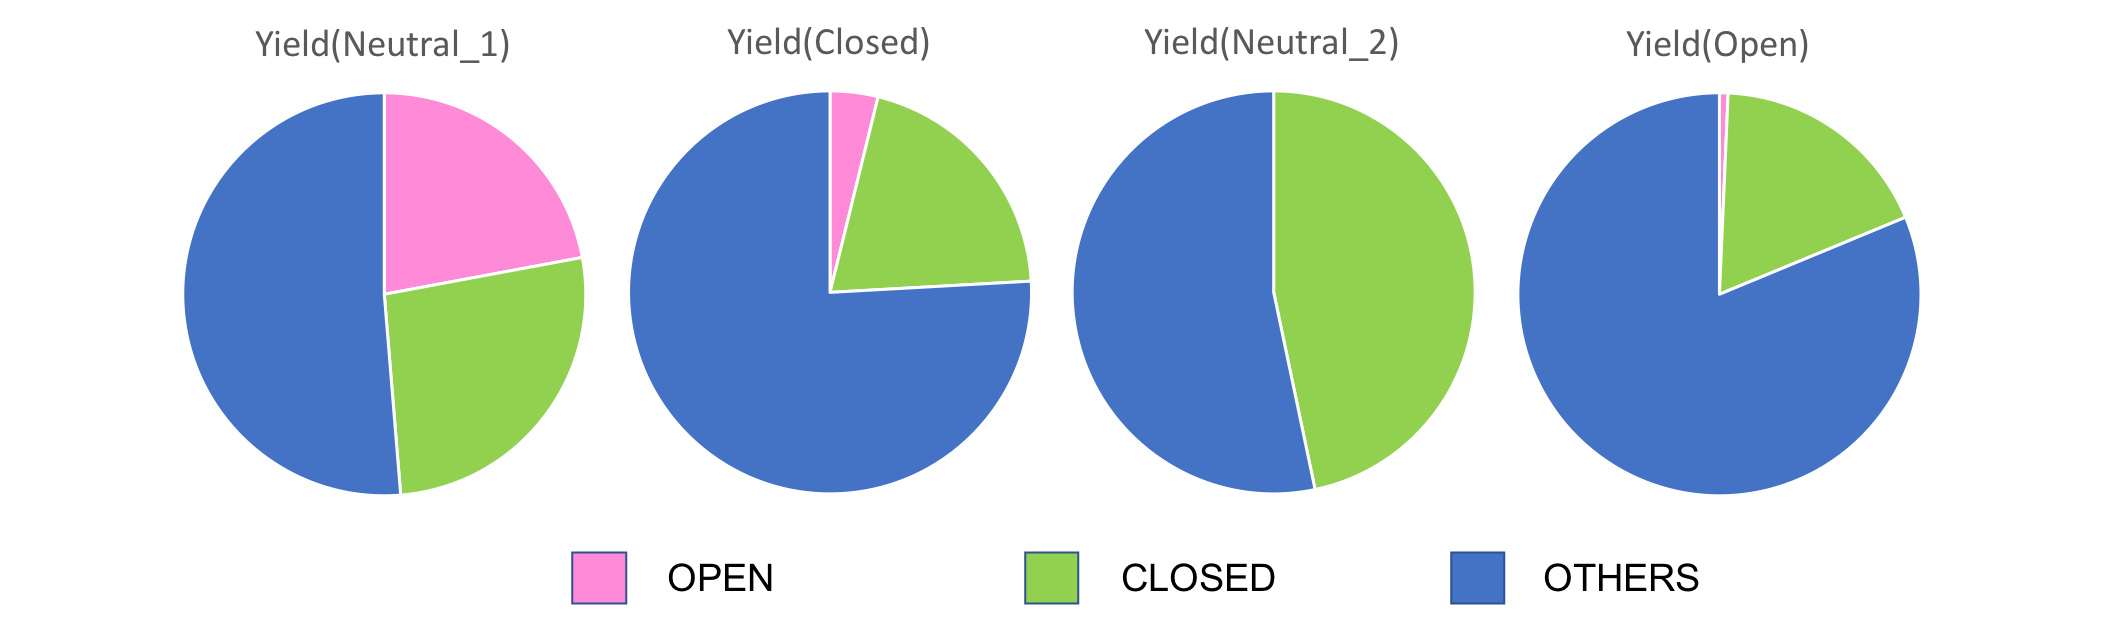
Fig.10 TEM analysis
From Fig.10, first for transitions from Neutral_1 to Closed, unexpectedly, the yeilds for closed structures were seen to decrease. However, at the same time, Open state structures decreased while others increased, suggesting the designed units to still be in their transitioning phases from Open to Closed. Also, for transitions from Neutral_1 to Closed, the decrease in Closed state structures is thought to derive from human errors during the counting process due to over-counting the unclosed structures. Next, for transitions from Closed to Neutral_2, Open structures are seen to decrease while Closed structures are seen to increase. This is thought to be due to the units completing their transitions to the Closed state upon insertions of Close DNA strands. For transitions from Neutral_2 to Open, the ratio of Open stuctures are seen to increase upon insertions of Open strands, while sturctures of Closed state is seen to decrease. Thus, Open DNA strand was seen to function according to our designed mechanism.